Contributed by: Sciemetric Staff

In our previous posts, we have explored how digital process signature analysis can improve defect detection on the line, quickly and accurately establish more effective limits, and optimize test cycles so that the test station is as efficient as possible.
Another benefit that comes from this data-driven insight using digital process signatures is the ability to adapt and adjust for greater agility and efficiency on your line.
Learn how applying digital process signatures on your line allow you to adapt and adjust for improvement production, below.
Adapt to product line variability
Many manufacturers produce variants of the same part or model on the same line, which often require changes in limits, cycle times, tooling, and more, for each specific part. All this impacts productivity and raises the risk of quality issues. The proper limits and parameters for each specific part must be applied and monitored to ensure a quality build.
By applying process monitoring solutions and digital process signature analysis, you can substantially accelerate the calibration and verification process between different model runs to reduce down-time and meet urgent deadlines, while also ensuring quality output.
Launch new machines or lines faster
Digital process signatures can also be used to help accelerate the start up and runoff of new lines and factories.
By using signature-based test data and today’s analysis tools, engineers can develop test algorithms for specific defects to accurately set test limits for new stations and lines.
For example, they can:
- Employ failure and defect Paretos to identify the top sources of failures
- Conduct “what if” experiments off-line to create tests that will catch defects
- Generate a runoff report if the station is built at an integrator or machine builder site so performance can be clearly shown at installation. This reduces the time and effort needed to dial-in the new machines
- Compare machine performance to that of existing lines, applying common metrics to ensure targets are met
These benefits allow manufacturers to get lines up and running faster, and the benefits continue after the line or plant has launched to support predictive maintenance.
Predict machine maintenance needs before they show up as defects
Even the smallest changes in the typical signature for a process can be an early warning sign of impending quality defects due to issues like tool wear or equipment that is becoming misaligned, etc.
Take the below example from a plant producing engine parts for several automotive OEMs. At one station, a horizontal boring machine rough cuts a body part for an oil pump. The cuts are performed by tooling inserts that need to be replaced after every 200 cycles. Inserts, however, can chip or wear in fewer than 200 cycles and cause defects in the parts, resulting in a surge in the scrap rate. The flawed process manifests as edges on the outside diameter of the oil pump body and uneven face depths when the tool hits a cavity on the face of the part.
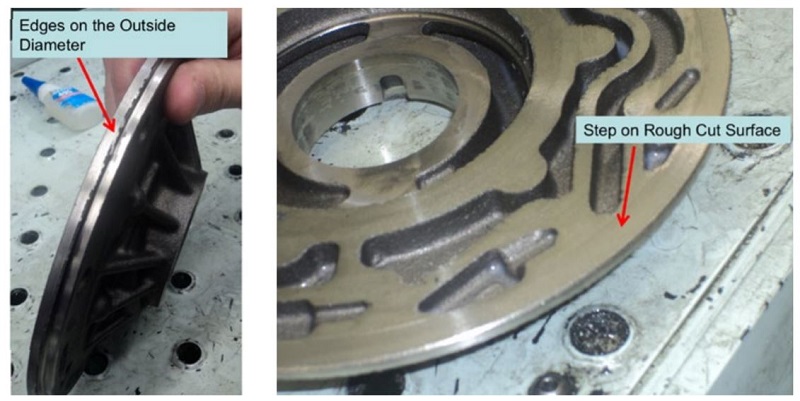
Figures 1 and 2 (above) are examples of where increased noise and vibration will indicate a wearing or damaged insert in need of replacement. But this station is automated – there is often not an operator present to hear that noise and vibration. Even if there were, relying on the attentiveness of an operator introduces a high degree of subjectivity and risk of human error.
A sigPOD unit with digital sensors and an accelerometer was connected to the station to capture and analyze process signatures. This established clear limits and a baseline profile of an optimal process that made the indicators of a worn or chipped insert easy to spot.
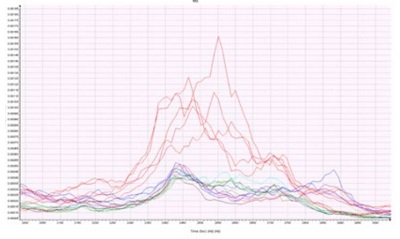
Figure 3 (left) shows a frequency vibration analysis for this process station, in which vibration is converted to a frequency waveform. The flatter the line, the cleaner the cut. But as the tooling inserts get dull, more force is required to make the cut and vibration increases. This is exhibited by the more and higher peaks (the red lines) in specific frequency bands.
By collecting and visualizing relevant data, unexpected quality issues were eliminated, scrap rates were reduced, and maintenance requirements could be addressed proactively. This dramatically improved the optimal operation of the station.
In our next blog post, we will discuss how digital process signatures can be used to enable continuous improvement of your production processes.
Contact us to learn more about how process monitoring and analysis using digital process signatures could be applied for improvements on your line.