Contributed by: Sciemetric Staff

Data is everywhere on today’s production lines. The challenge is that though manufacturers may be collecting large volumes of data, it often isn’t being used proactively or efficiently to solve day-to-day problems. Data gathered from your manufacturing processes has the potential to improve your line efficiency and FTY, boost product quality, and in some circumstances, even save your — but only if the systems are set up to allow for this kind of insight and action through data analysis.
Consider the following best practices to start making better use of your production line data.
1.Consolidate your production data
Bring all of the data together from your plant floor systems and consolidate it into an accessible structure. A modern data management and analytics platform has the capability to ingest data from disparate sources – it is flexible and agnostic. This will eliminate the data silos common with using different machine vendors and allow you to scale down what it takes to manage the various types of software and hardware on the production floor. It will also enable you to do correlations from stations across the line, provide consistent reporting and a top-level view of manufacturing processes.
During this process, consider how you want to use the data to ensure you are collecting the right amount of useful information. Depending upon the size of your organization and the types of parts manufactured your needs may differ. If creating standard production reports is the main requirement, for example, less data is required than for test station optimization.
2.Standardize your production data reporting model
Having a standard data model for your plant floor systems greatly simplifies implementation and assures project success by levering standard off-the-shelf reporting. For instance, if your data model standard identifies traceability to a specific part by serial number (highly recommended), this will ensure all tooling suppliers program their logic controllers accordingly, or have the appropriate barcode readers/scanners or part-marking systems in place.
3.Look at parts, not just machines
Monitoring performance of machines is important to ensure operational efficiency. However, focusing solely on this leaves a gap when trying to fix issues such as improving cycle time, tracing root cause of defects to avoid them in the future, etc.
Every cycle of every process and test station on the line generates data related to the part being produced or tested, including scalar data, digital process signatures and images. The more data you collect, the more insight you have into what has happened to a part at every assembly step.
Anything that happens upstream can have a bearing on a problem that arises further downstream. Take an engine assembly that fails a leak test, for example. The next step is that you’ll need to identify what the cause of the failure is – a faulty gasket due to improper dispensing, an improperly installed gasket due to incorrect position, bolts that didn’t tighten down correctly, poorly machined surfaces due to excessive vibration at a machining center? To get answers, you’ll need to dig into your data.
Getting to the root cause of this flaw could require investigation of a dozen or more machining, dispensing, fitting and rundown operations, each with its own dataset. By having all the datasets relevant to a part collected and organized into a single birth history record, and indexed by part serial number, tracing root cause will be a much easier and effective process.
4.Apply data visualization for greater insight and comparison
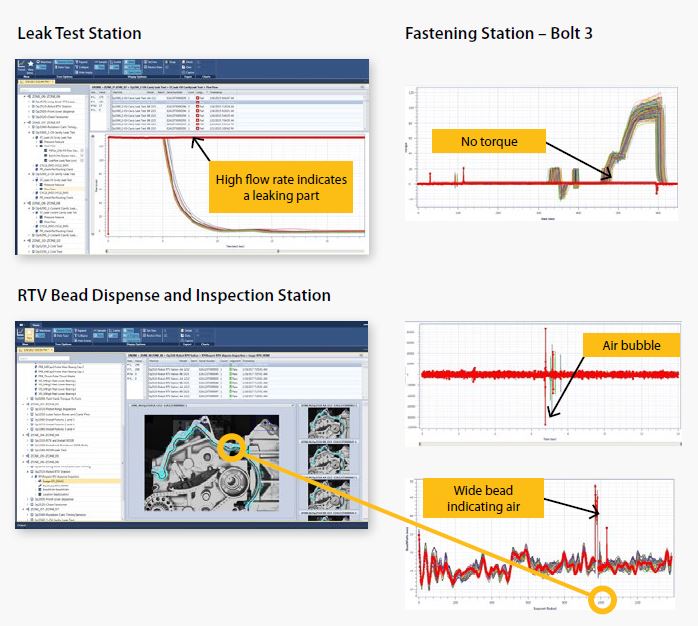
Using a tool that allows you to visualize your data from assembly stations makes the analysis of complex information easier. For example, using Sciemetric solutions, you can view, analyze and overlay digital process signatures (waveforms) for part test data across stations and quickly spot problem areas.
This in-depth analysis capability means that a part failure can easily be distinguished from a test malfunction. Detailed, signature-specific mathematical modelling can be used to find anomalies that require further investigation, pinpoint where problems occur during a process, and even optimize a test station by understanding how to shorten the test.
The sheer scope of the available data from manufacturing systems can be overwhelming. If you are a manufacturer struggling with your production data management and strategy, it may be helpful to speak with a professional to assist in organizing the data based on your typical plant floor initiatives, requirements and goals. The team at Sciemetric is available to answer any questions you may have—contact us!

Learn how to use data to improve your production line, including:
- How to look at the production problems you’re experiencing to know if you have a gap between data and insight
- How to turn "Big Data" into better data
- How to apply the right data management and analysis tools and capabilities to make your data work for you
- How we are helping manufacturers bridge the gap between the data they collect and how they use it to drive continuous improvement