Contributed by: Sciemetric Staff

As the number of connected systems in the industrial environment increases, manufacturers are becoming increasingly aware of the value of production data and manufacturing metrics to resolve issues quickly and proactively manage production.
But it isn’t enough just to be collecting the data—it needs to be organized and accessible in a way that benefits your team in day-to-day management and issue resolution on your production line. With the right tools and organized data system, here are some of the day-to-day benefits you can expect:
1. Set up new test systems quickly with data for limit setting and management
At one component company, it was taking weeks to find the correct test limits for an automotive sensor – it even took days for a simple calibration. By adding data analytics capability to the test system already installed on the line, scalar data and new digital process signatures that offered deeper analysis could be collected and analyzed together, in one common place. The data collection and analytics software did the work to automatically calculate statistically based limits and the correct processing algorithms within 30 minutes, saving the manufacturer exorbitant time and money.
2. Experiment “what-if” using historical data without affecting production
It is very helpful to be able to use historic data to run simulations to see how changes to the test will impact production. For example, determining where and how a test cycle can be shortened without affecting quality. This boosts productivity and can even reduce the number of test stations required.
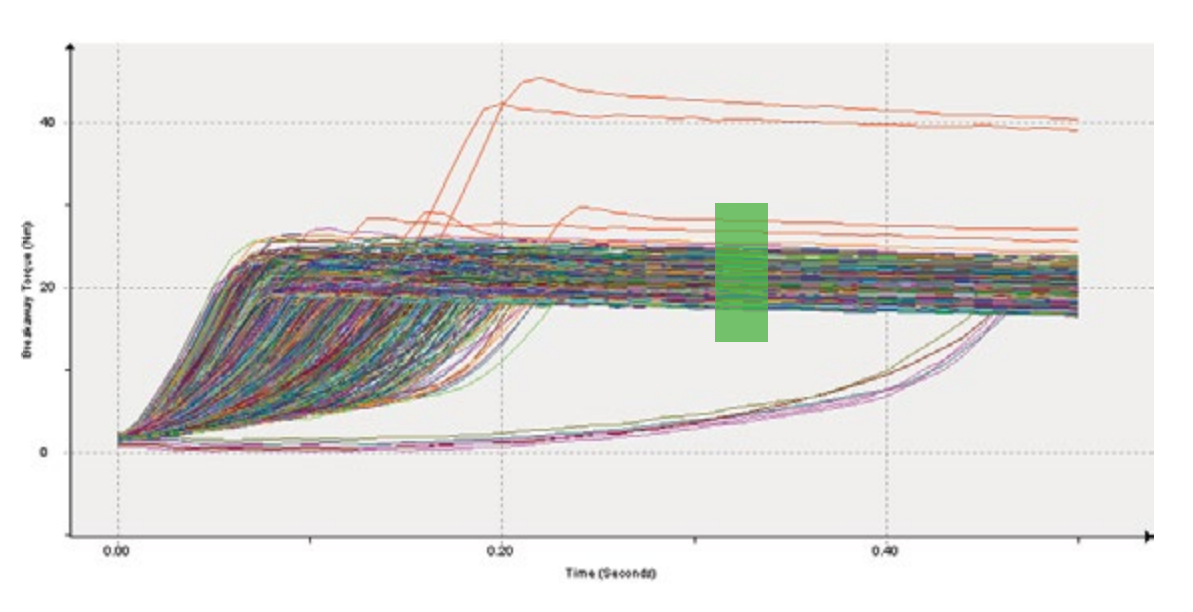
In the image above, a manufacturer was only looking for peak breakaway torque as part of a torque to turn test. Analysis showed that ending the test cycle sooner would have no impact on quality. By adding a new test and terminating the cycle based upon this result, a seven-cycle savings per eight-hour shift could be achieved. For this plant, that amounted to a production increase of 132 parts per month.
3. Troubleshoot and runoff new equipment and new lines faster
Having the data intelligence to be able to accelerate runoff is particularly valuable for large manufacturers that may be launching lines with 50, 100 or even 500 machines strung together. One weak link will hold up the entire line. Bottlenecks can be identified immediately. Root causes can be diagnosed and eliminated systematically. New control limits can be verified and easily adjusted. Process signatures from the new line can be matched against existing ones to give a strong indication of conformance.
4. Compare and manage performance for parallel stations or like stations, across the one line or many lines
Innovations in one plant can be reliably applied to other plants, providing a many times increase in yield. We worked with one customer that could launch new lines around the world an average of four times faster, for estimated average savings of US$4 million per plant, using its data in this way.
In addition, don’t suffer the consequences of the same problem occurring twice. Once the root cause of a production or quality issue has been identified, the comparable process, test or machine on other lines or at other plants can be adjusted before they can suffer the same problem.
-
Learn the lesson once, then apply it as often as needed for continuous improvement
You can also avoid situations where additional parallel process or test stations must be installed and staffed to maintain quality and production quotas. Any insight from your data that enables seconds to be shaved from each cycle of a process or test can yield substantial savings in equipment and staffing costs.
5. Visualize the problems that occurred during the production of a part—and fix it
For example, a fuel rail leak was detected at an automaker’s plant. This slowed production and caused a quarantine situation for thousands of vehicles. Analyzing the test data revealed that all failures were marginal passes. This meant they had just barely passed the quality tests. In this case, the test limits being used on the test stand were those originally supplied by the part designer and had not been monitored after production startup.
The quality manager used one week of manufacturing test data to assess the impact of applying more scientific statistically-based limits. It was determined that tightening the test limits would have caught the faulty fuel rails and yet would have had a very minor impact on throughput. Two months’ worth of part data was retested, applying the new limits to identify other suspect parts.
Three additional suspect parts were found and their serial numbers forwarded to the assembly plant. Production resumed at full speed since confidence in the parts had been restored. Not only was this urgent bottleneck addressed, but the potential recall situation by end customers was entirely averted.
6. Be able to prove the quality of your parts and assemblies
More and more, component manufacturers must provide proof to OEMs that show their parts/sub-assemblies meet specifications and don’t pose a quality risk. When a potential recall arises, it is all the more important to be able to quickly demonstrate compliance to the spec or analyze the data down to the part/serial number level to determine whether the component issue can be traced and fixed.
So, how do you effectively organize and correlate your part production data?
To start achieving the above day-to-day benefits of organized and correlated production data, you will need to have a compatible data management and analytics system in place that allows you to access the information you need from your critical-to-quality stations, when you need it, and be able to glean actionable insight to take immediate action.
Our QualitWorX suite for manufacturing data management and analytics connect industrial systems and assembly processes with real-time data collection software to provide the visualized, data-driven insight you need to take charge of your line.
Let our data experts show you how Sciemetric’s QualityWorX suite of tools could be applied on your production line to turn your part data into actionable information to empower your decisions and transform your manufacturing operations. Build better products, meet yield goals, and reduce costs. Contact us today.