Contributed by: David Mannila
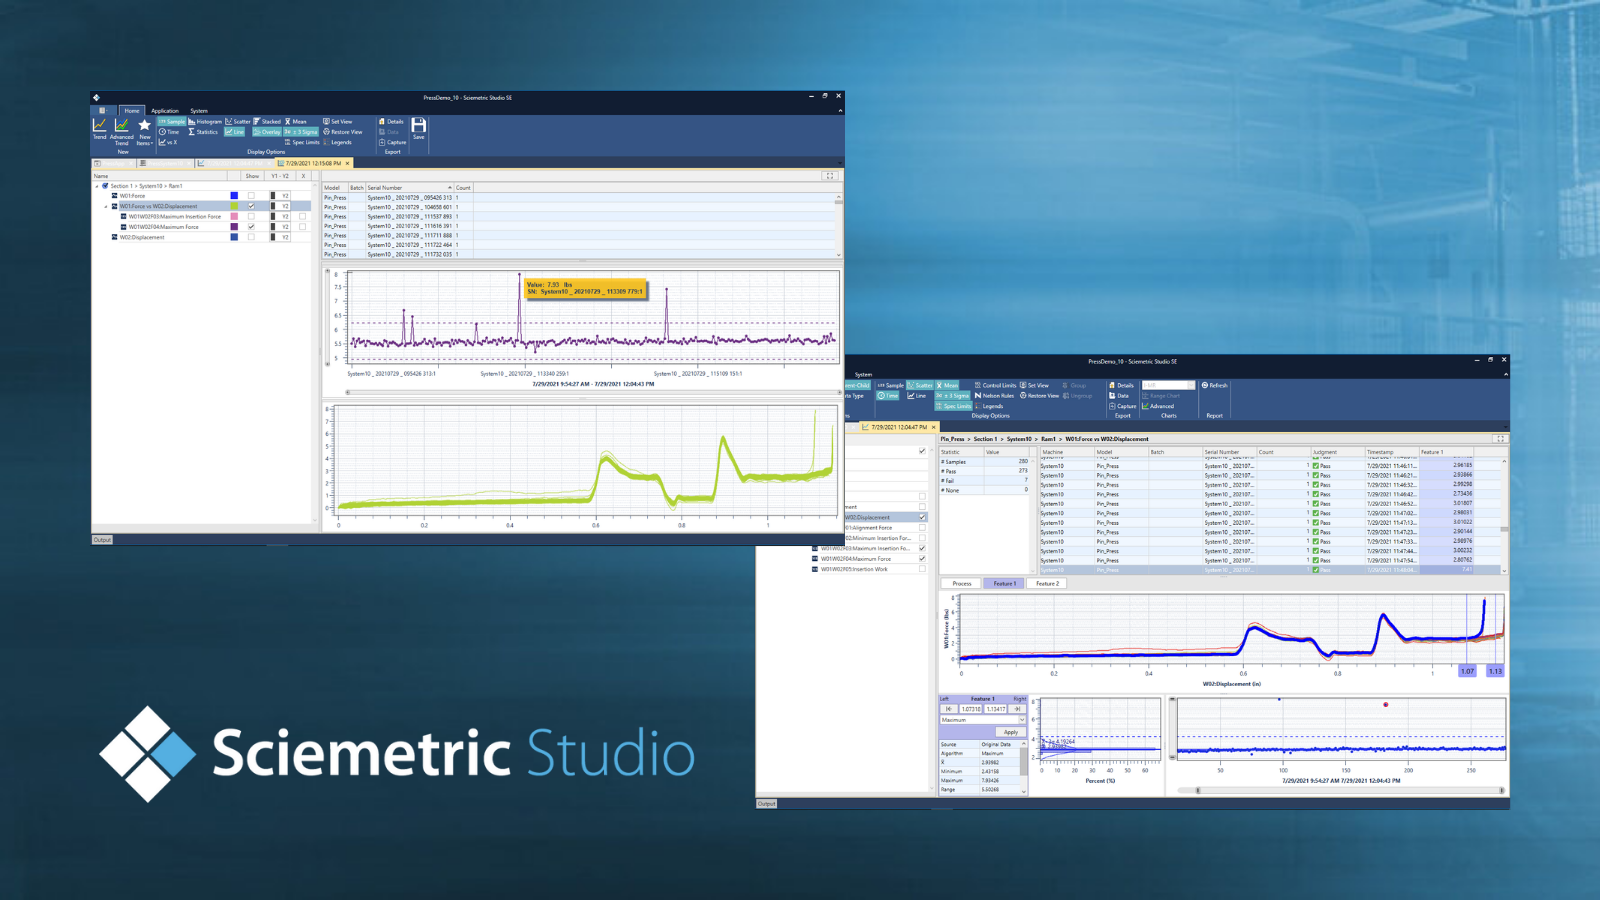
Sciemetric Studio, our manufacturing analytics software platform that’s been proven and trusted by customers around the globe, continues to evolve with new features and functionality to drive more value from your production data. Learn how the latest updates and features of Sciemetric Studio will take your data analytics capabilities to the next level, below.
Real-time SPC and alerts engine: Know when your process is out of control
Sciemetric Studio now offers the use of Nelson rules for Statistical Process Control (SPC), in production real-time or on any historic dataset. You can enable rules locally, then create alerts for continuous real-time data monitoring, or scan data already collected in a QualityWorX database for potential rule breaches, using SPC-based charts to inform better limit setting.
The real-time alerting engine provides live out-of-control data detection. When an event (rule breach) is detected, alerts can be logged and sent by email for quick action. Access-controlled audit logging also enables full traceability of any SPC configuration changes and rule breaches.
Watch this video to see the alerts engine in action
Advanced Trend: Enhanced capabilities for even better defect detection
Manufacturing consistently high-quality parts depends on consistent processes. With Sciemetric Studio enhanced Advanced Trend capabilities, you can now easily compare your data from any process or test station, or a combination of stations, to spot problematic variations. With all of the information at your fingertips, you can easily drill down to a single part test history by serial number, to see where the problem exists.
Trend reports help you identify issues affecting quality and determine ways to optimize a station’s productivity. Several types of trend views are available (statistics, pareto, waveform, image filmstrip, histogram, etc.), so you can isolate and analyze the data from all angles and check for correlations across different process measurements on the production line.
Watch this video to see it in action
Waveform Analyzer: Conduct simplified ‘what-if’ analysis offline
Once you have identified issues on the line, determine how best to prevent them from happening again with the new Waveform Analyzer capabilities. Using the Waveform Analyzer, your team can apply and test different parameters on historical data and get immediate feedback without affecting live production.
Easily view the affects of new test parameters for any process and test station on the line, to ensure a defective or borderline part doesn’t slip through your testing as a marginal pass. Determine where and how best to alter limits, identify the potential need for new feature checks, and compare different types of feature analysis to determine the best approach for catching a defect.
Watch this video to see it in action
More power, at your fingertips
- Use SPC-based charts, Nelson rules and alerts to monitor and track the health of your line.
- Use enhanced data analysis and comparison capabilities to quickly find and address the root cause of defects upstream.
- Experiment offline with your existing test or process data for improved defect detection and continuous improvement.
The latest updates to Sciemetric Studio make all of this easier than ever before. Learn more about Sciemetric Studio.
Contact us for a demo and learn how Sciemetric’s data analysis tools enable you to drive greater value from your data, to sharpen your plant’s competitive edge.

Learn how to use data to improve your production line, including:
- How to look at the production problems you’re experiencing to know if you have a gap between data and insight
- How to turn "Big Data" into better data
- How to apply the right data management and analysis tools and capabilities to make your data work for you
- How we are helping manufacturers bridge the gap between the data they collect and how they use it to drive continuous improvement