Contributed by: Sciemetric Staff
The fuel system in a modern internal combustion engine is a high-pressure and high-precision assembly that’s calibrated to deliver just enough fuel to the injectors at just the right time, depending on how hard the gas pedal is pressed by the driver.
Check valves in these lines prevent any backflow that can interfere with engine performance. Faulty valves can lead to engine failure, or in the least, can cause the ‘check engine’ light to come on and result in warranty claims by vehicle owners.
One engine manufacturer we worked with was having end of line (EOL) engine function test failures and couldn’t figure out why. Their valves were not performing during the EOL hot test; the check valves were releasing during test, indicating a bad assembly. But the parts had passed leak test upstream, so they couldn’t figure out why this was happening.
Using their process data, Sciemetric systems enabled analysis that pinpointed the anomalies and allowed them to set up new feature checks to catch these problems in the future, before the part moved further down the line.
Read on to learn how Sciemetric systems enabled this analysis, and how these tools could be applied to pinpoint and prevent problems on your line.
SEE HOW TO USE SCIEMETRIC’S DATA SOLUTIONS TO IMPROVE YOUR LEAK TEST
Using production data to identify the root cause of a leak test problem, upstream
We began by examining the digital process signatures, or waveforms, generated during the leak tests of engine valves that had failed their EOL tests. We were able to quickly identify the waveforms of the parts in question by serial number (see below).
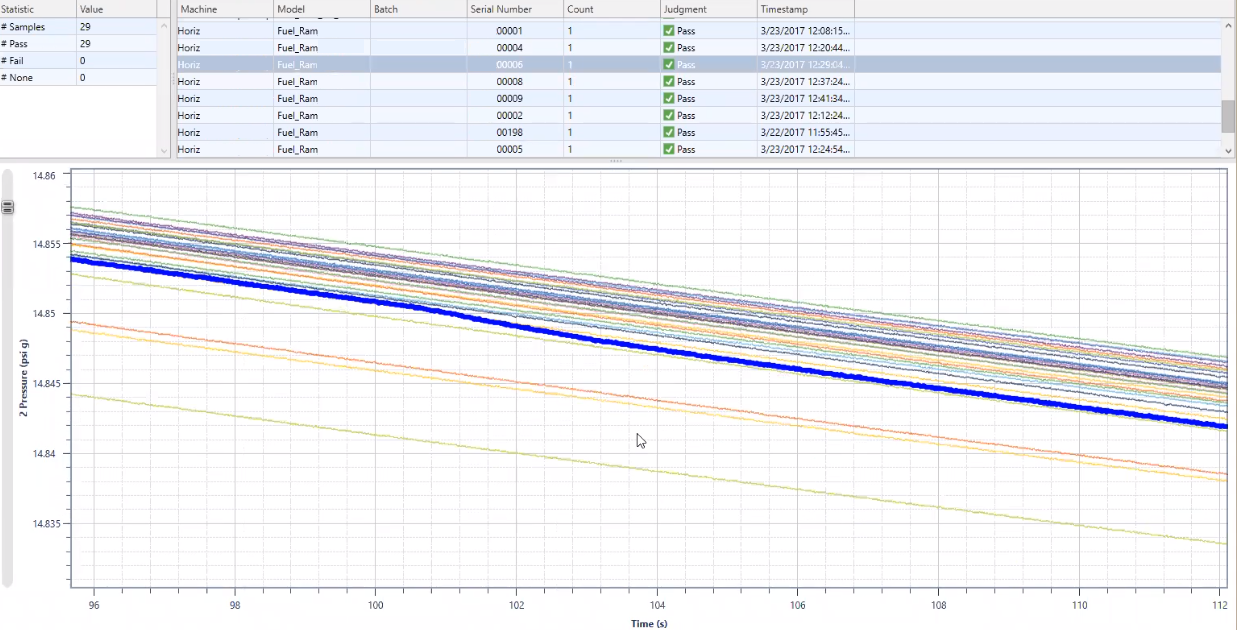
In this view, it is evident that there is a very slight “cracking” or pulse, by each faulty check valve during its leak test. The test pressure was only 15 psi, when it should have taken magnitudes greater pressure for that valve spring to crack for even a split second. The fault caused a very slight leak of about two CCs over a few seconds that would then self-correct (evident in the waveform, above).
This deviation went unnoticed given the current leak test ‘pass’ parameters. So, we employed Sciemetric’s “what-if” analytics tools to help identify new or altered featured checks that would catch this deviation during the leak test.
Using Sciemetric’s “what-if” analysis tools to validate problems, identify new feature checks to catch quality problems sooner
We employed Sciemetric’s “what-if” data analysis tools to experiment with the process data offline, looking for different ways of looking at the data that would identify the deviations more clearly. This would confirm our suspicions that this was the deviation indicator linked to the EOL failures and give us a new parameter to use at the leak test station to catch this problem before the faulty parts moved further down the assembly line.
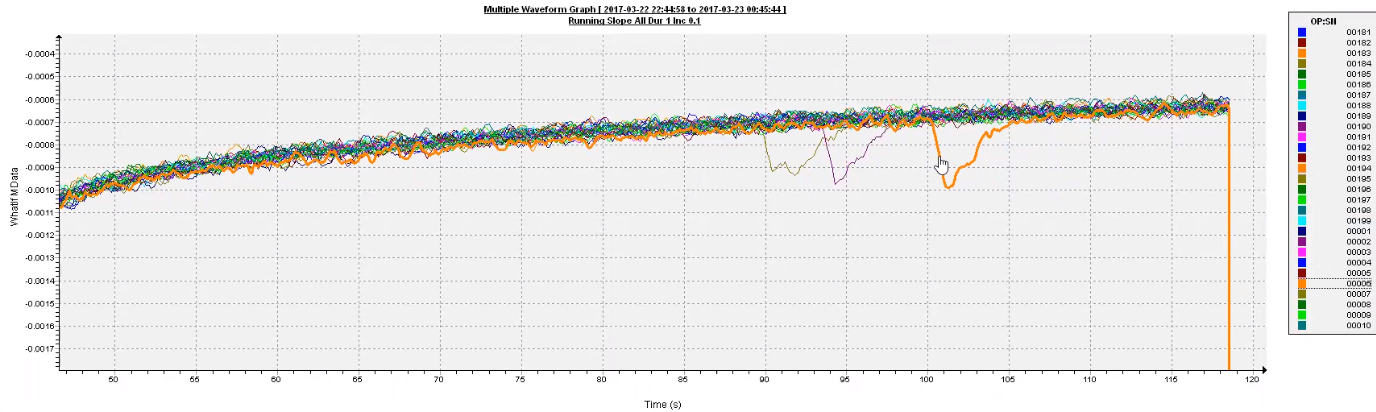
Instead of looking at pressure loss, which was not highlighting the variations clearly enough, we tried applying a running slope algorithm to the waveform. Zooming in on this graph, 3 clear deviating waveforms became evident, identifiable by serial number in the sidebar (see below). We then compared this data to our original pressure loss view, confirming that these were the same parts (by serial number) that were showing slight deviations, validating the problem.
We then implemented the new algorithm as part of the leak test station quality checks on the factory floor for more accurate pass-fail in production real-time, ensuring faulty parts weren’t making to the EOL test station.
SEE WHAT ELSE YOU CAN DO WITH YOUR DATA USING SCIEMETRIC STUDIO
Process monitoring combined with meaningful data analysis prevents defects from reaching the end of the line
Our goal is to catch any defect well before the end of the line, as close to its point of origin as possible, to reduce its impact on the line’s yield, efficiency and profitability.
The key in this case was being able to access the right data, collected and archived by part serial number. Having the digital process signature of the entire leak test cycle provided us with the granularity to zoom in on the data and determine how best to highlight deviations that had otherwise been missed.
Contact us to discuss how Sciemetric’s defect detection solutions could be applied to pinpoint the problems on your production line.