5 ways to make a manufacturing engineer’s life easier
May 18, 2023
Manufacturing Management,
Data Management & Analytics,
IIoT / Smart Manufacturing
Practical ways to use your data to improve quality and response time to daily issues
Manufacturing engineers are relied on to support product quality and throughput on the production line. You are faced with keeping equipment up and running, solving process problems, and lean manufacturing has continued to increase this workload.
Efficiencies are required to keep up with this new demand and learning to make the most of your manufacturing data is critical to solving production issues quickly and efficiently in this fast-paced environment. Here are 5 practical ways to make your life easier, using your data to improve quality and response time to daily issues.
1) Store the Right Data, in the Right Format, in the Right Place
Quickly respond to quality issues with centralized data collection and analysis
There is a lot of data available on a connected production line and many data types. But collecting data just for the sake of collecting is inefficient. Here’s how to strategically approach your data collection:
Collect all kinds of data applicable to your part quality, including waveforms, features, spec limits, part-specific parameters, pass/fail results, images, defect and repair results, and more.
Differentiate between parts so you can reference the information when issues arise. This means storing part data by a unique serial number for each part and having an organized filing structure in your software for quick analysis.
Centralize data collection on your line. Digitize key process variables and store the data through gateways to a central location, allowing for quick data retrieval response to issues. Everything that happens to a part can be stored and is traceable. Data can then be accessed from any location for plant, line, and station comparisons. This also makes for quick compliance reporting.
2) Use Data Reporting to Improve Quality
Identify production and quality issues and solve day-to-day problems
Often Engineers run data reports at the start of their day to get insight into the latest manufacturing issues. With digitized data stored to a central location, you can run useful reports that give you a good view of your whole production line.
Key reports to help you solve problems include the Part History report and Trend report:
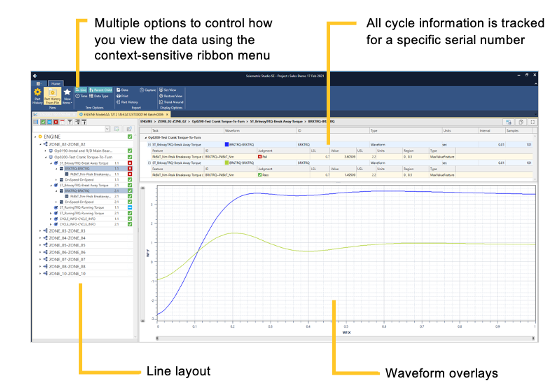
Part history report (example)
A Part History report shows the life of an individual part as it went through the manufacturing process. It highlights quality checks performed throughout the line and indicates compliance. Ideally, it provides consolidated data, with waveforms, scalars, and images all accessible and comparable in the same place.
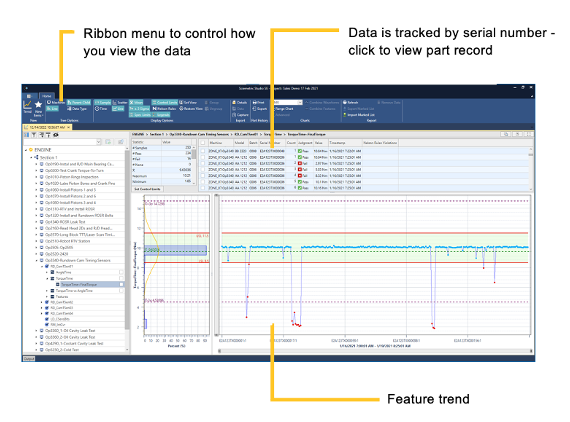
Trend report (example)
A Trend report is a group of parts based on criteria such as date range or specific models. Trend reports allow comparison of parts and stations to help expose quality and process changes. Here we see all parts in our dataset overlaid in waveform and feature trends quickly identify process anomalies. SPC plots and statistics also provide visibility into quality and process changes.
3) Optimize Production Using Data to Improve Quantity, Throughput
Identify bottlenecks, reduce cycle time, improve productivity, and speed up line launch
Optimizing production is key to improving the quantity of parts built per hour. This begins with First Time Yield (FTY) or First Time Through (FTT) tracking. This kind of data reporting gives visibility into where the problems are and how many parts are affected, which helps with addressing the biggest issues first. Here’s how you do it:
First Time yield (FTY) tracking provides a key measurement of line and process health indicating bottlenecks. Reducing bottlenecks improves line efficiency. The FTY or FTT report highlights the stations that contribute to the manufacturing bottlenecks. You can drill down to specific parts that failed each station and get better visibility into rework and re-test to improve production yield. These improvements can add up to significant cost savings per year.
Comparing stations can highlight process issues such as bad seals or test pressure variation, which can be fixed to ensure optimized cycle times.
Setting tighter test limits can also improve cycle time and just result in overall better defect detection. Ideally, you can review and analyze your production data offline to see how new test limits would affect your reject rate and Gage R results, without affecting live production.
Accelerate line or station launch using data-driven insight. Running a data simulation for quick re-analysis without running more production cycles, or using existing test data, can help you model new feature analysis, set test limits, and confirm station performance and accelerate development of a successful test strategy. This can reduce time and rework and allow Manufacturing Engineers to focus on improving the manufacturing process.
4) Use Data to Isolate and Quarantine Faulty Products to Improve Response
Identify the root cause of quality problems and isolate defective parts
Some defects are caught at end of line, or worse, once they are in the field. Data can be used to help Manufacturing Engineers quickly determine which parts should be quarantined when a quality spill occurs. The right data strategy can allow quick and efficient response:
Use data comparisons or add a new data feature to isolate the problem and identify which other parts exhibit the same defect. Quarantine bad parts before they leave the plant to minimize the quality spill, and identify any others for recall that may be already in the field. Response time is critical to minimize production delays and lower rework costs.
We have customers who have successfully reduced recalls to a small number of specific parts instead of a complete campaign affecting many customers.
5) Monitor Your Production Data to Improve Defect Detection
Detect defects as they occur and implement continuous improvement
Catching defects in real time boosts line efficiency and reduces rework costs. Data monitoring equipment can analyze data in real time and detect defects as they occur, ideally collecting and storing data to a central location for future analysis. Here’s how you do it:
Isolate key process variables that should be monitored in real time using warranty and quarantine data. Be sure to store data for every part to build process history.
Enable continuous process improvement to advance defect detection and information reporting. The key to continuous improvement is taking time to review and analyze your process data on a regular basis. Review the reasons for your passed and failed parts, and apply different features and test limits in an offline environment to identify problems at stations or inefficient processes to improve.
How Sciemetric Makes Your Life Easier
Sciemetric is here to help you close the information gap between problem to resolution on your production line. Our data monitoring and reporting tools were developed to help you produce high-quality parts with the highest efficiency possible. Let us know how we can help make your day easier.
Sciemetric’s solutions help you bridge the gap between your production processes and the insight you need to improve them. Connect machines, tests, and processes across your production line for the fastest issue resolution and most accurate insights for product quality and efficiency improvement.