
A key concern for any manufacturing or quality engineer is keeping the production line running smoothly and minimize the impact of any process deviations. Being able to respond quickly—to put out the fires that inevitably happen regularly—is what manufacturers want from the tools they use.
SPC to monitor trends, provide alerts
Statistical Process Control (SPC) is an industry-standard methodology for measuring and controlling quality during assembly operations. SPC is great at helping to flag an issue, identifying manufacturing issues by monitoring trends in key process variables and can alert plant staff about any operations that are deviating from acceptable parameters—a sign that there may be an issue with the machine that will lead to quality problems.
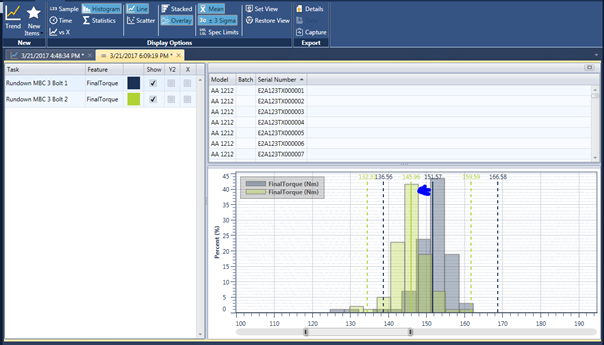
While SPC is great at finding these deviations, it isn’t easy to find out why something happened and fix it quickly. Some say the data is too limited and doesn’t provide the visibility necessary when trying to dig into the root cause of an issue. For example, SPC would tell you if the standard deviation on the rundown operation on bolt 2 is too high, but not what is causing it. It’s only possible to trace the root cause of a process or quality issue in a reactive and indirect fashion using statistical correlation.
Using Sciemetric Studio to upgrade and enhance SPC capabilities
Sciemetric Studio is a real-time SPC and manufacturing analytics software that bridges the gap between information and action. In addition to monitoring the process, Sciemetric Studio focuses on monitoring the parts being manufactured. In conjunction with QualityWorX, it provides a serial number-based birth history repository that captures digital process signatures, data, test limits, part parameters, defect and repair information, pass/fail results, operation counts, and more.
Having this data means you can see a deviation in SPC and in a few clicks drill down into the affected parts to analyze the root cause of the problem. Looking at the part data for bolt 2 you received an alert on, you could pinpoint where the issue is occurring in the torque process and see, for example, that it is being tightened less than bolt 1.
SEE SCIEMETRIC STUDIO IN ACTION! GET A DEMO
Performing real continuous improvement in manufacturing
The benefits of a solution that combines SPC and part data don’t end with fast tracing of root cause. The archived data can be used for further analysis and process improvement so your team can:
- Use historical data to see the impact of test changes on quality and cycle time before implementing them
- Determine better test limits
- Increase first-time yield and cut rework costs
- Reduce cycle times
- Monitor and manage machine performance
- Avoid downtime and boost efficiency
- Improve response time to issues
- Pinpoint defective units to avoid mass recalls
- Drive continuous improvement across the enterprise
See how you can upgrade and enhance your SPC to make it easier to manage quality on your production line.
View All Blog Posts