Press-fit, where parts are joined using force, remains one of the most common of manufacturing operations.
Like any common manufacturing operation, a press-fit must be monitored to prevent flaws and defects from impacting part quality. In this series, we will dig into how press defects can be found using digital process signature analysis software, what to monitor in a press operation and also provide examples from actual press operations.
GET A QUOTE FOR YOUR PRESS APPLICATION
Finding part, process or machine issues using waveforms
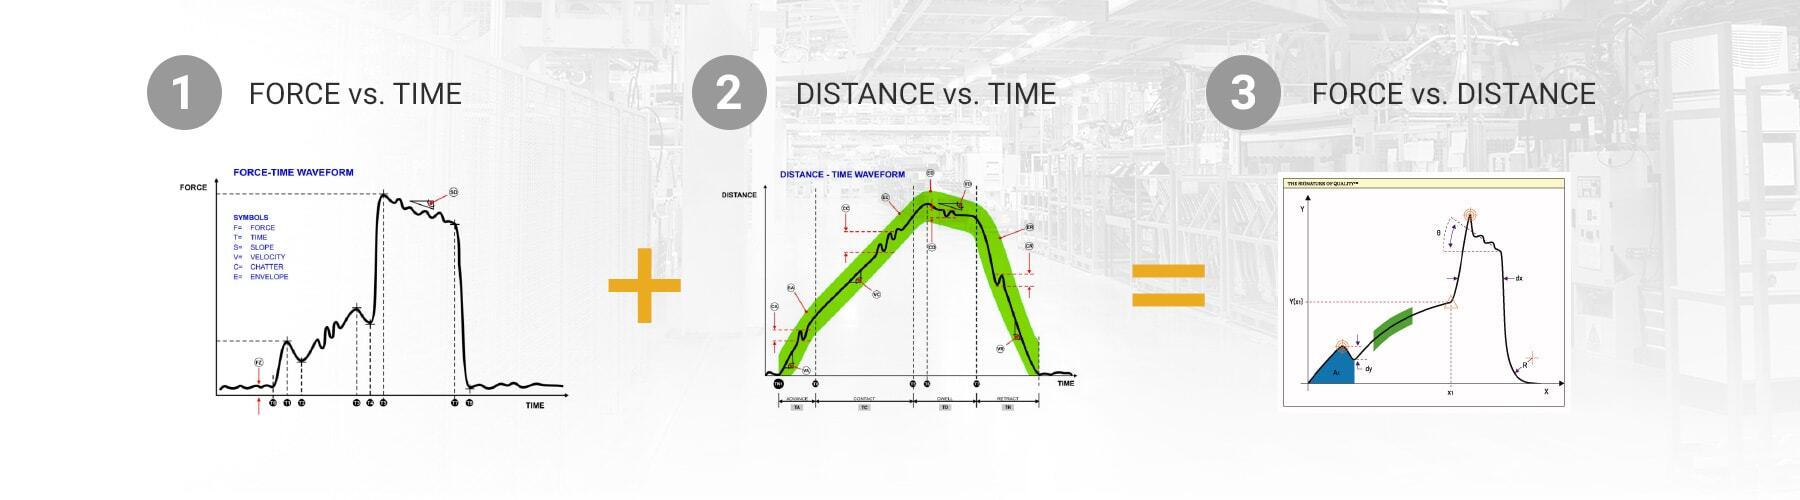
The health of a press fit operation can generally be determined by evaluating three primary process signatures:
- Force vs. Time: How much pressure and for how long, had to be applied for the operation (or process cycle) to complete?
- Distance vs. Time: How far did the component move and how quickly, during the operation?
- Force vs. Distance: How much pressure did it require to move the component a specific distance?
The most powerful forensic tool for press-fit defect detection is the digital process signature (waveforms).
A signature is a visual representation of everything that happened to the part through each millisecond of the press-fit operation. By equipping the press-fit station with the right combination of software and sensors such as load-cells or position and pressure sensors, the signature of each press-fit operation can be captured and visualized. Those three features – Force vs. Time, Distance vs. Time, Force vs. Distance – can be easily measured and compared between different operations of the press.
Take this example (image below), where a pin is being pressed into a part. The pin diameter is slightly larger than the bore it is being pressed into, which ensures it never comes loose and falls out.
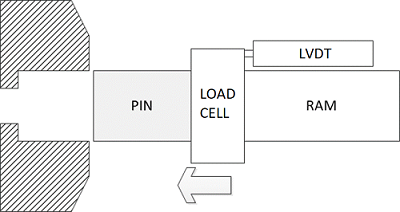
We can use a load cell to capture the force and a Linear Variable Differential Transformer (LVDT) to digitize the distance as the ram forces the pin into place. This creates the force vs. time and distance vs. times curves. Combining these, we can create a force vs. distance waveform, or signature, as shown below in below image.
The next step is to understand how the unique attributes of the signature, its shape, correspond to information about the real physical process.
The stages of a press curve
In the graphic below, you can see three basic stages of a press curve:
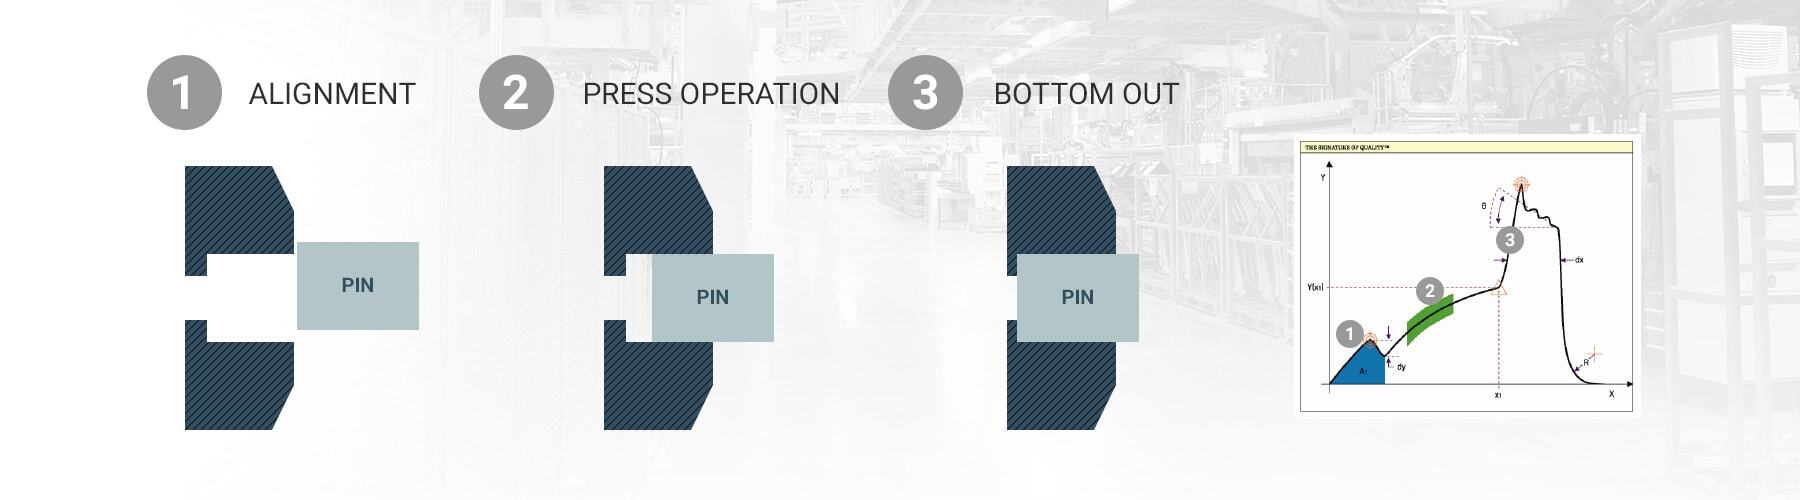
Stage 1: In the first stage if the part is not perfectly aligned there can be a rise in the force as the part hits the side of the opening first then moves into the opening. This may indicate an issue with tooling setup or wear.
Stage 2: As the pin is pressed in, the force increases due to greater surface area in contact. The value of the force in this area indicates the tolerance of the parts. Too high a force indicates too tight of a tolerance, while too low indicates an overly loose fit.
Stage 3: The third stage is where the pin makes contact with the bottom of the bore. Here there is an increase in the force with little distance, as is shown by the steep rise in the force vs. distance curve. The degree of steepness, or slope can be an indicator of the stiffness of the press machinery and show wear over time.
Anomalies in the process signature can flag any number of issues with either the part or the machine itself. Next time, we will explore further what to monitor in a press fit operation and what issues can be identified.

LEARN MORE ABOUT SCIEMETRIC'S SOLUTIONS FOR PRESS MONITORING