We often discuss how digital process signature analysis can be used to catch defects as they occur during production. But what if, even after rounds of adjustments and better limit setting, a new problem crops up that casts doubt on the quality of goods already produced and shipped to customers?
Sometimes, a problem may only become evident after the unit is in the field and suffers some kind of failure that leads to a warranty claim. The original limits set for a process or test station may have appeared sufficient, but new faults may emerge. Too many warranty claims and the manufacturer may find itself facing a recall.
The most critical step in such a situation is to first trace the root cause. Until you know what is causing the problem and where process/test limits may have to be tightened to prevent it, the risk is that your production line is still producing flawed parts.
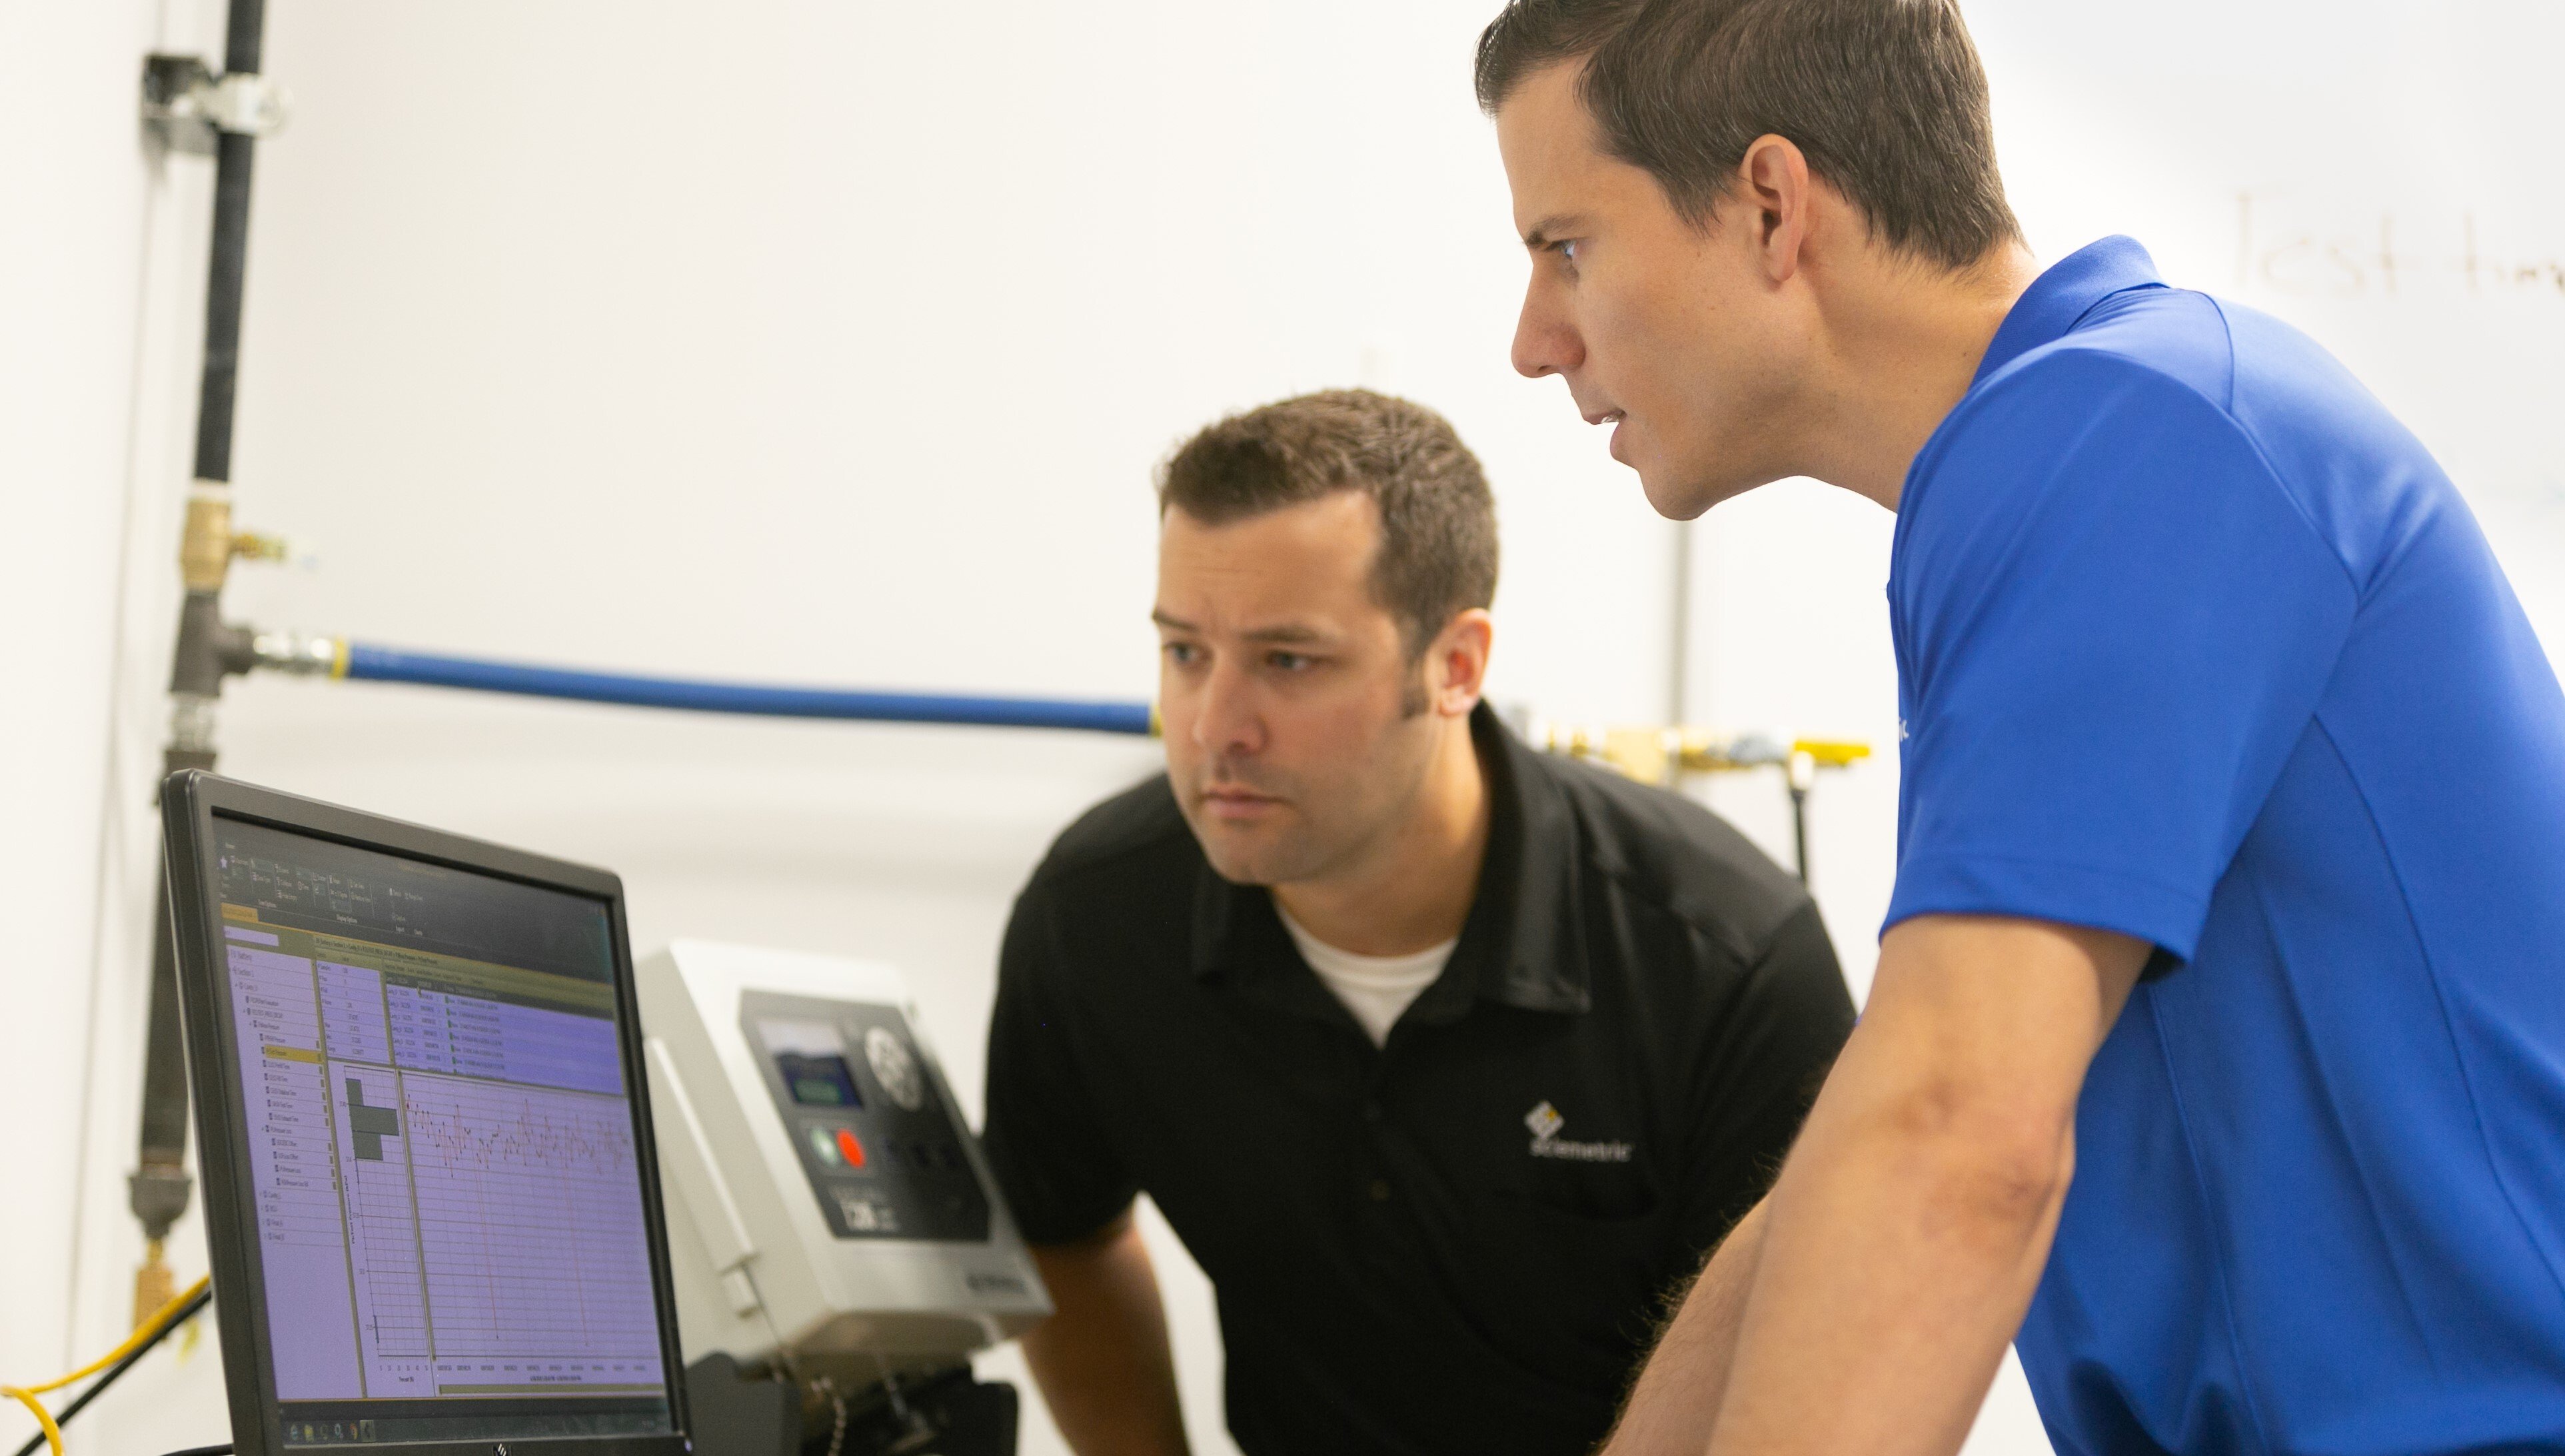
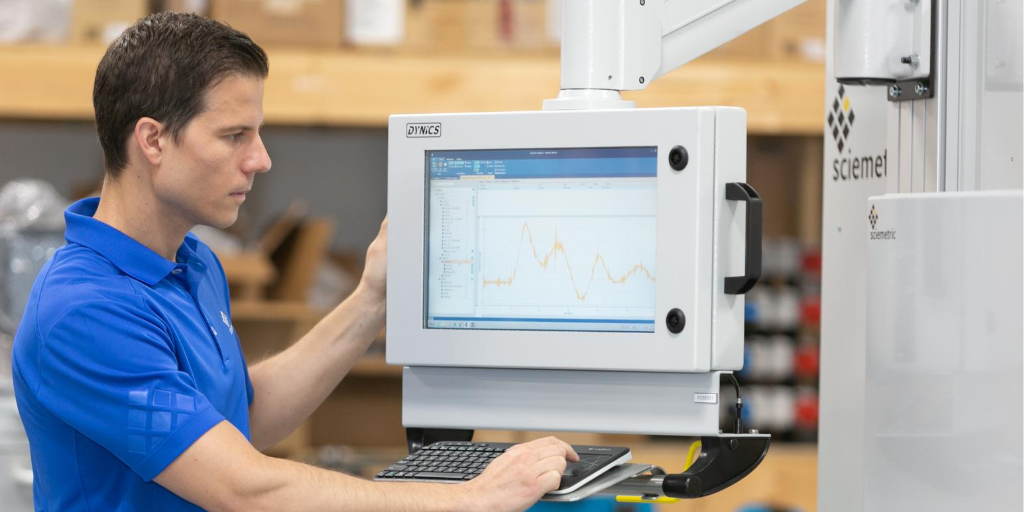
This is where digital process signatures prove their value in continuous monitoring and production improvement. Process signatures are key to achieve the rapid troubleshooting that will reduce downtime and avoid more unhappy customers. Time and again, we have documented cases where root cause analysis with process signatures has accomplished in a matter of hours what would have otherwise taken days or even weeks using the trial-and-error approach that manufacturers are stuck with when scalar data is the only data at their disposal.
IMPLEMENT CONTINUOUS IMPROVEMENT ON YOUR PRODUCTION LINE
Case study: Identifying problems during end-of-line test for electronic throttles
Take this example, where a manufacturer suffered from a high failure rate with the end-of-line test for an electronic throttle.
Despite throttle components having passed every quality check up to that point, some 200 engines were facing rework – a significant repair cost.
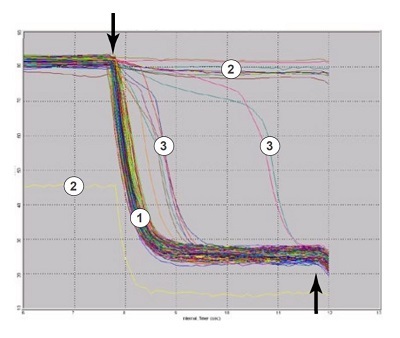
By analyzing the digital process signatures captured during upstream vacuum testing (see image, left), quality engineers determined that only total failures (#2 in this image) were being caught.
Why? Because only start and stop pressures were used to determine pass/fail in the test (as indicated by the arrows), some defective throttles were still passing the test (#3 in this image). These subtle failures were enough to be causing those headaches at the end of the line.
The team determined that 77 percent of these additional failures resulted from stuck or sluggish throttles and the remainder were false rejects. With this insight, test algorithms and limits on upstream test stations were adjusted to reduce the number of false rejects.
Using digital process signature analysis, this manufacturer reduced its failure rate to 0.07 per cent, or 10 engines a month. By addressing these issues, the manufacturer could now increase overall output by 170 engines per month.
The ability to overlay current and/or historical process signatures to quickly see if there were any anomalies allowed the manufacturer to swiftly address the problem—and allows for ongoing monitoring and analysis at your fingertips to ensure your line is always producing quality parts.
Enable the power of digital process signatures on your production line
Process signature analysis equips your lines and your entire plant with a powerful toolset to drive continuous improvement and quality gains, while delivering the traceability that your customers and partners expect.
Contact us to learn how digital process signature technology could help you continuously monitor and improve your line—whether it’s one specific station, one line, or across your whole enterprise.
View All Blog Posts