In our last post, we talked about the value of digital process signature analysis to enable more accurate and effective defect detection. This entails equipping the process or test station on the line with the sensors and data processing capability to generate a signature, or waveform, in production real time. The signature serves as an “instant replay” record of what happened through each millisecond of the process or test cycle.
Now, for that process signature to have any analytical value—so the operator can tell whether the cycle has completed within acceptable limits with a quick glance at a screen—we must first establish those limits.
Optimizing limits eliminates false failures and reduces the risk of giving bad parts a passing grade. On process stations, it ensures parts will meet spec and the process will be completed within acceptable parameters, to prevent a failure down the road that could lead to a warranty claim or a recall.
And yet, many manufacturers still rely on manual methods of trial and error to establish limits, with piles of spreadsheets and manual calculations. We see this in action quite often.
Faster, more effective limit setting using the part production data
At one component company, this method had the team working for weeks to find the correct test limits for an automotive sensor—it even took days for a simple calibration.
By employing digital process signature analysis and some additional analysis of hundreds of signatures from the same test, this component company established correct processing algorithms with associated limits within only 30 minutes. Day or weeks of work were cut down to minutes by relying on hard statistical analysis rather than guesswork.
With an archive of signatures from a process or test station, a range of tests can be run on the same stored data rather than running additional parts through the process to validate parameters. This saves both the time and expense of running parts and allows for rapid test development.
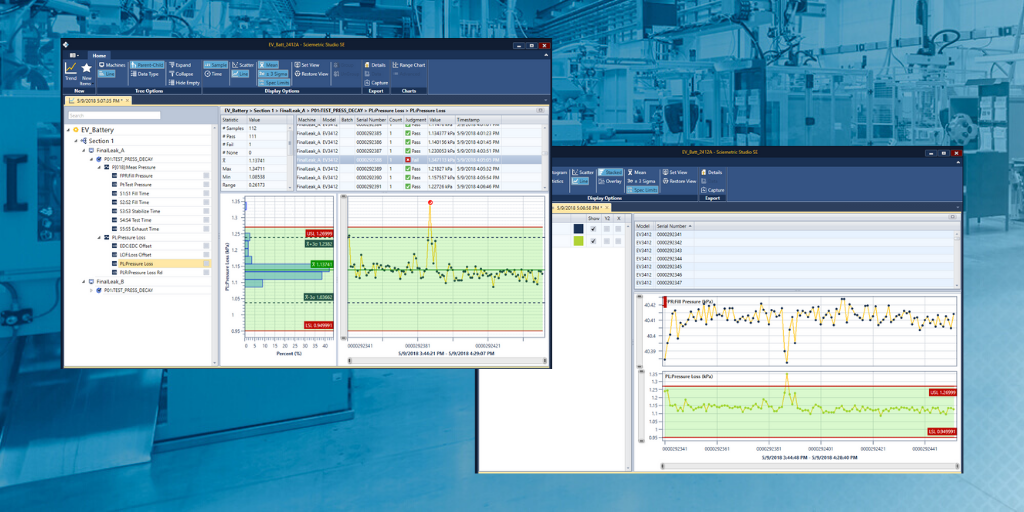
Consider this other example in the figure below:
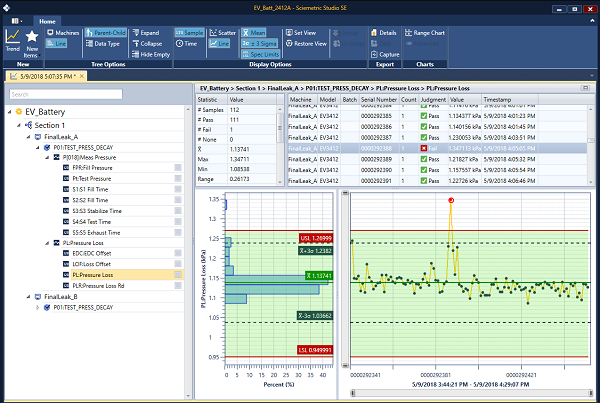
This visual shows two failures in the data set. What if the limit were lowered? You can see in the trend on the right that the optimized limits would have identified eight statistical outliers which are suspect parts. This is an example of how accumulating data combined with greater experience with a process can lead to tightened parameters, with very little time or effort.
The end result? Higher quality, lower scrap and rework rates, fewer recalls or warranty claims and happier customers.
These are the very benefits espoused in Smart Industry’s recent Technology Report, which states: “Manufacturers recognize now that they need consistent, meaningful and comparable data sets to optimize their production processes.”
In our next post, we will discuss how to use digital process signatures to optimize test cycle times.
CONTACT US TO LEARN HOW DIGITAL PROCESS SIGNATURES
COULD BENEFIT YOUR APPLICATION