
In our previous post, we talked about how digital process signature analysis eliminates the guesswork and trial-and-error from limit setting for processes on the line. This same advantage extends the test cycle at the test station.
The longer the test cycle, the more challenging it becomes for the test station to keep up with the pace of production. It may become necessary to set up and operate parallel test stations – increasing the plant’s equipment, maintenance and labor costs.
But before resorting to those measures, consider if the test cycle time can be shortened, and to what degree, without any compromise in quality.
You can perform this analysis using digital process signatures. Let’s use the below example using data from a breakaway torque station to illustrate this process.
Example: Using data visualization to improve cycle time at a breakaway torque station
Take the figure below, in which signatures from scores of breakaway torque tests have been overlaid.
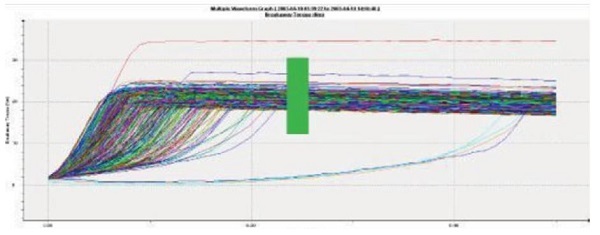
In this real-world example, digital process signatures have allowed for the visualization of data, illustrating how much torque is required to start the rotation of the part. Once in rotation, the torque falls off as running torque takes over. For this test, we aren’t concerned with running torque, what’s important is that breakaway torque completes with a characteristically fast rise time and that peak torque is not too high (these are the limits that distinguish a pass from a fail).
That red line represents a unit with much higher breakaway torque than the rest. This may indicate that lubrication is missing or the incorrect bearings have been installed. As you can see, several other signatures are also outliers, but in these cases, they do achieve the same running torque as good units. This may indicate missing components.
Using digital process signatures to identify the quickest effective cycle time for the test
What’s important to note is that this test is running for twice as long as necessary to identify defective parts. All the “normal” signatures, along with many of the outliers, have achieved breakaway before the time indicated by the green box. By this point, enough of the signature has been captured to reliably differentiate a good part from a bad one.
If the manufacturer had continued to test with the original cycle time, only half as many units could be tested per hour, or per shift. By shortening the cycle time, the test station can now handle any likely increase in production from a single line, or even take on the output from two lines.
Apply digital process signature analysis to optimize cycle times across your line
This same above concept extends to other test and process stations on the line, including leak test, press fit, and more. Just as with the torque example above, digital process signature trend analysis allows you to pinpoint the minimum cycle time required to identify good from bad parts, so you can produce the best quality parts while keeping production moving.
In our next post, we will take a broader look at the value which process signature analysis can deliver to your whole line and your entire plant.
CONTACT US TO LEARN HOW DIGITAL PROCESS SIGNATURES
COULD BENEFIT YOUR APPLICATION